AI Cloud Architect — observability generated alongside the code
Observability-as-Code: Dashboards, Alarms, Notifications
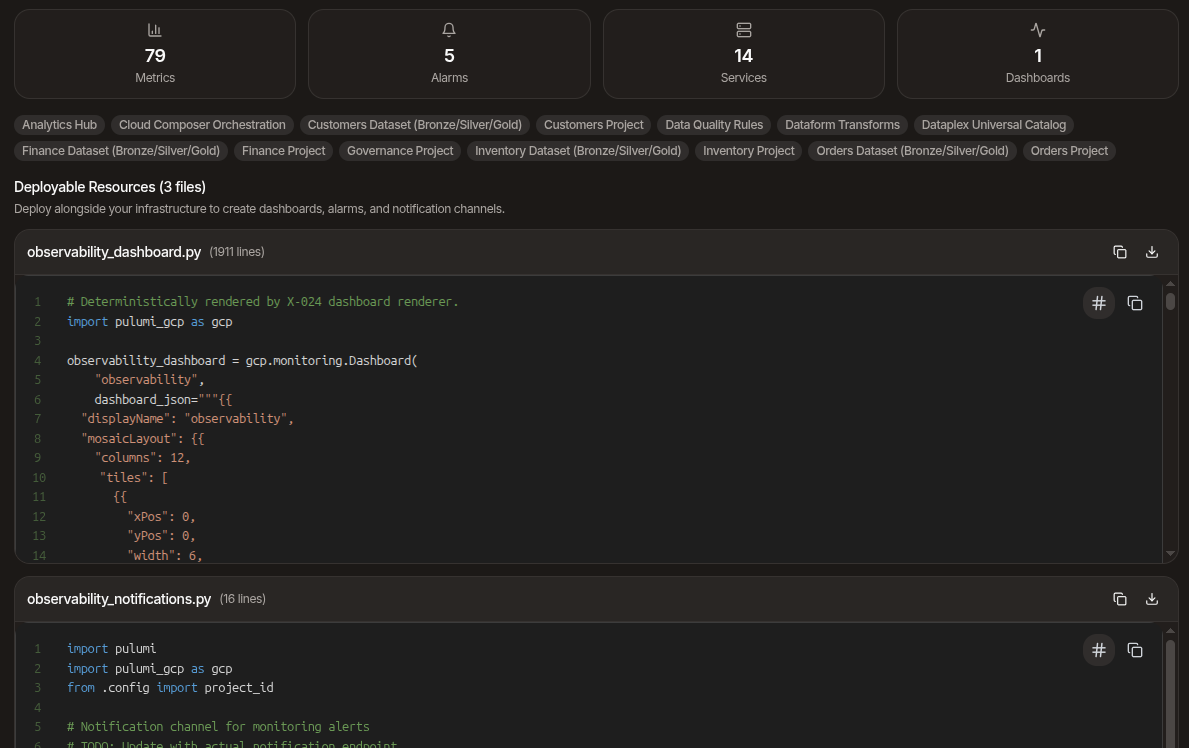
Cloud-native dashboards, alarm policies, and notification channels generated alongside your infrastructure code. Same architecture, same providers, same git PR — observability ships in the same export.
Dashboards rendered deterministically
The dashboard for each architecture is built directly from the diagram — every node and edge category maps to a curated set of metrics and widgets. On AWS that is a CloudWatch dashboard resource. On GCP it is a google_monitoring_dashboard. On Azure it is an Application Insights workbook (or a Bicep-native equivalent). The widget layout is consistent, the metrics are correct for the resource type, and the dashboard ships ready to apply.
Because the dashboard is built directly from the architecture, regenerating it does not produce arbitrary re-shuffling — the same input produces the same dashboard, every time.
Alarms and notification channels
Alarm coverage fills the gaps without overwriting what's already there — when the infrastructure code already declares monitoring for a resource, it is left alone; when it does not, the right alarms are added with thresholds appropriate to the service. Notification channels (SNS topics, Action Groups, notification channels) are generated and wired up so the alarms have somewhere to go.
Existing alarms are preserved — only the gaps get filled. Architectures that already declare CloudWatch alarms or Cloud Monitoring policies are not overwritten.
Grafana dashboards on demand
Some teams run Grafana on top of cloud-native observability. A separate one-click action generates two Grafana JSON dashboards — one Prometheus-backed, one cloud-native-backed — that you can import directly into a Grafana instance. The dashboards reflect the same architecture and the same metrics surfaced in the cloud-native dashboard.
Cross-resource references stay correct
Dashboards, alarms, and notifications reference resources in the infrastructure code — module outputs, exported values, resource IDs. Cross-file references are resolved against the generated code, so they ship wired up.
Same git PR as the infrastructure code
Observability files live next to the rest of the infrastructure in the export — they are not a separate module, a separate branch, or a separate review. When you push to GitHub, GitLab, or Bitbucket, the dashboard, alarms, and notification channels arrive together with the rest of the architecture.
Related capabilities
Ready to design your next architecture?
Describe, sketch, or upload — diagram, code, security, cost, and docs in one flow.